Cost analytics
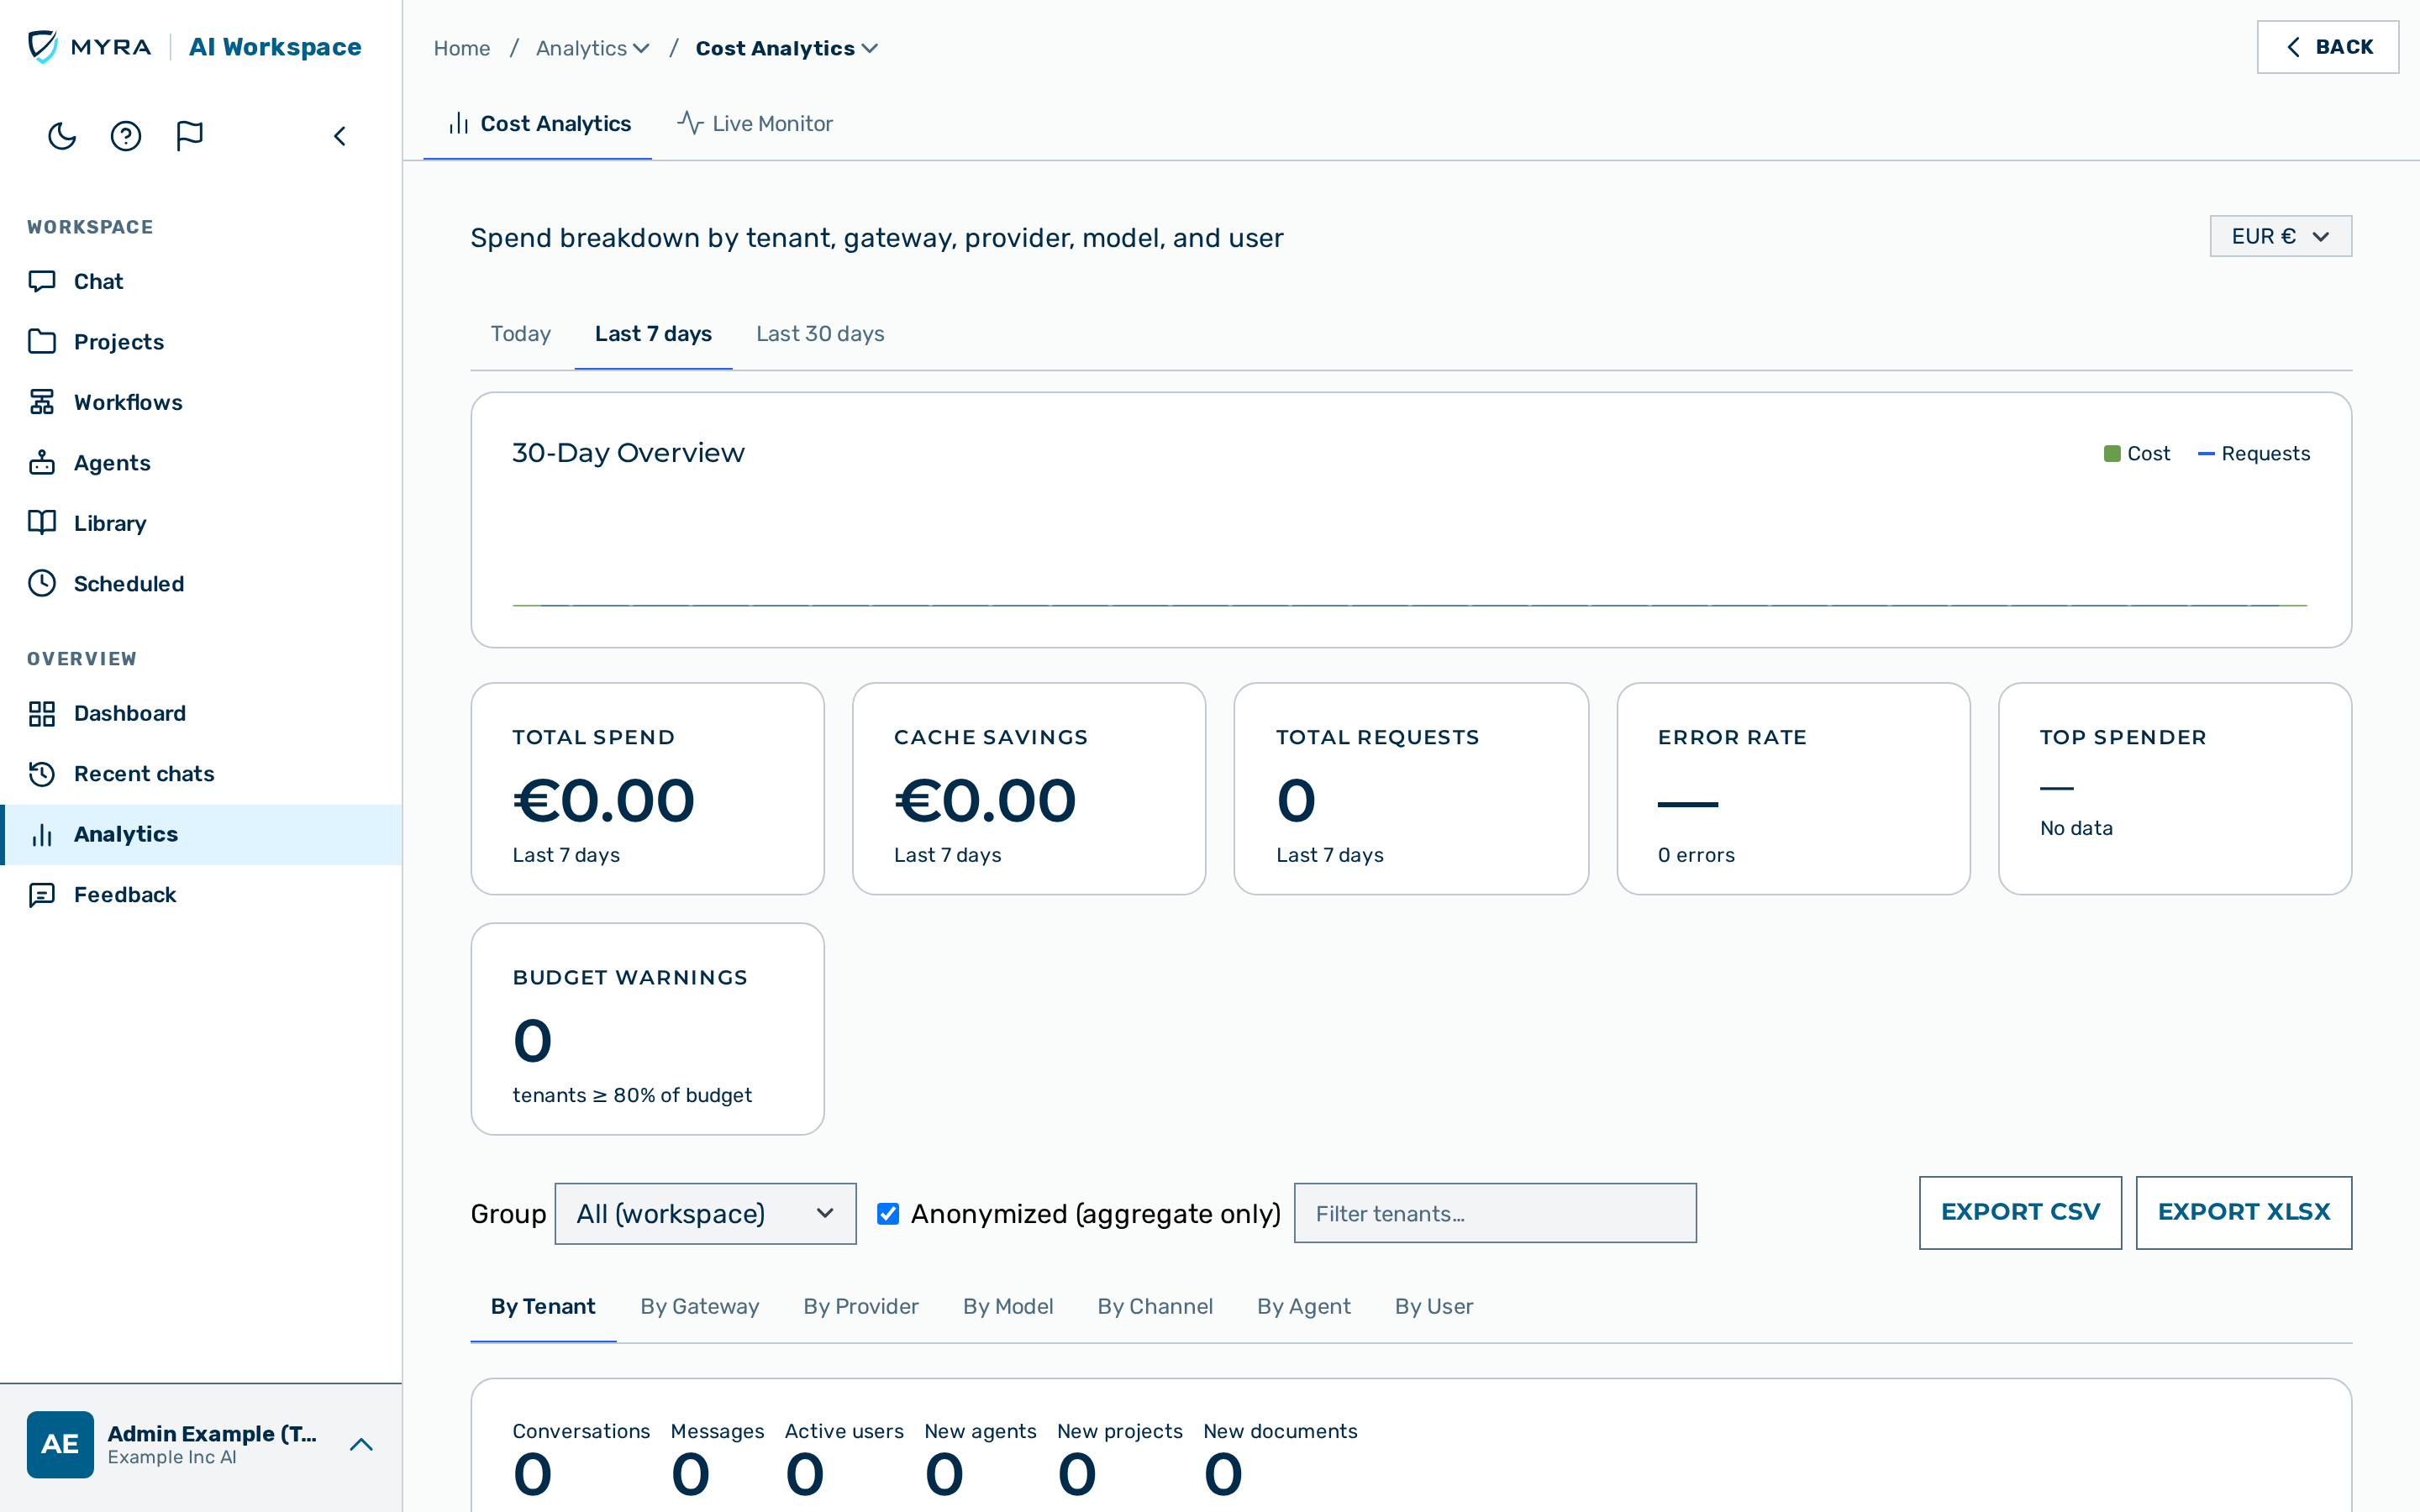 The cost analytics view showing the overview chart, summary cards, and analytics tabs.
The Cost Analytics view provides a spend breakdown across all tenants, gateways, providers, models, and users. Reach it via Overview › Analytics › Cost Analytics in the left rail (its sibling tabs are Live Monitor and Health).
Member reactivation
At the top of this view, admin and tenant_admin users see a member-reactivation card for the tenant. The card reports the member states (never activated, lapsed, dormant, active), the reactivation e-mails sent in the last 7 and 30 days, how many members reactivated, and the opt-outs. When the tenant's reactivation setting is off, the card states that instead of showing zeros. See Reactivation e-mails for the cadence and controls.
Period selector
A row of period tab buttons in the top-right controls the analytics window for all cards and tables on the page.
| Option | Window |
|---|---|
| Today | From your local calendar midnight to now |
| Last 7 days | Rolling 7-day window |
| Last 30 days | Rolling 30-day window |
Next to the period tabs, a Currency selector in the page header sets the currency used for every cost figure on the page. Costs are metered in USD; EUR is shown as an approximate conversion at the daily reference rate (the last known rate, or a built-in reference rate, is used if the rate service is briefly unavailable).
30-day overview chart
A combined bar and line chart always shows the last 30 calendar days, regardless of the period selector. Green bars represent daily cost (left scale); the blue line represents daily request count (right scale).
Latency strip
Three chips below the overview chart show latency percentiles for the selected analytics window:
| Chip | Description |
|---|---|
| p50 | Median end-to-end latency in milliseconds |
| p95 | 95th-percentile latency |
| p99 | 99th-percentile latency |
Percentiles cover non-blocked requests only. — is shown when no data is available.
Summary cards
Six cards summarise the selected period across all tenants:
| Card | Description |
|---|---|
| Total Spend | Cumulative cost in USD |
| Cache Savings | Cost avoided by serving cached responses |
| Total Requests | Total request count |
| Error Rate | Percentage of requests with a 4xx/5xx upstream response |
| Top Spender | Tenant with the highest spend in the period |
| Budget Warnings | Number of tenants at or above 80 % of their configured budget |
Filter bar
A single control bar appears above the tab bar. It hosts, from left to right:
- Group — administrators, tenant administrators and KI-Managers can narrow every breakdown to one user group. KI-Managers see only the groups they manage (the default covers all of them); administrators can pick any group in their workspace.
- Anonymized (aggregate only) — the privacy toggle described under By user below.
- Text filter — type to search by name or ID within the active tab; the row count updates as you filter (
N of M). The filter clears automatically when you switch tabs. - Export CSV / Export XLSX — export the active tab as a CSV file or an .xlsx workbook (see Exporting a breakdown).
Analytics tabs
By tenant
| Column | Description |
|---|---|
| Tenant | Tenant slug |
| Requests | Total requests |
| Cost | Total cost in USD |
| Share | Proportional bar showing the share of total cost for this tenant |
| Cache | Cache hit rate (%) |
| Errors | Error rate as a percentage; badge shown only when errors > 0 |
| Blocked | Blocked request count; badge shown only when > 0 |
| Avg Latency | Average end-to-end latency in milliseconds |
| Budget | Budget utilisation bar if a budget is configured; unlimited otherwise |
Clicking a tenant row opens the tenant detail panel.
By gateway
| Column | Description |
|---|---|
| Gateway | Gateway slug |
| Tenant | Owning tenant |
| Requests | Total requests |
| Cost | Total cost in USD |
| Share | Proportional bar showing the share of total cost for this gateway |
| Cache | Cache hit rate (%) |
| Errors | Error rate; badge shown when errors > 0 |
| Blocked | Blocked request count; badge shown when > 0 |
| Avg Latency | Average end-to-end latency in milliseconds |
By provider
Aggregated client-side from the model-level data by grouping rows under their provider.
| Column | Description |
|---|---|
| Provider | Provider slug (e.g. openai, anthropic) |
| Models | Number of distinct models used |
| Requests | Total requests routed to this provider |
| Cost | Total cost in USD |
| Share | Proportional bar showing the share of total cost for this provider |
| Avg Latency | Average end-to-end latency in milliseconds |
By model
| Column | Description |
|---|---|
| Model | Model name |
| Provider | Provider slug |
| Requests | Total requests to this model |
| Input Tokens | Total input (prompt) tokens for this model |
| Output Tokens | Total output (completion) tokens for this model |
| Cost | Total cost in USD |
| Share | Proportional bar showing the share of total cost for this model |
| Avg Latency | Average end-to-end latency in milliseconds |
By channel
The channel is the surface the request came through: the web UI, a raw API key, or an agent.
| Column | Description |
|---|---|
| Channel | Request surface: UI (chat), API key, or Agent |
| Requests | Total requests |
| Input tokens | Prompt tokens consumed |
| Output tokens | Completion tokens generated |
| Cost | Total cost in USD |
| Errors | Error rate; badge shown when errors > 0 |
| Avg Latency | Average end-to-end latency in milliseconds |
By agent
The agent breakdown reports usage per agent, counting a shared agent together with every clone of it.
| Column | Description |
|---|---|
| Agent | Agent name |
| Invocations | Total calls to the agent |
| Conversations | Distinct chat sessions in which the agent was used; agents invoked only headlessly (API or schedule) count as invocations, not conversations |
| Distinct users | Number of distinct people who used the agent, counted across the shared agent and its clones |
| Cost | Total cost in USD |
Above the table, a Calls over time card shows a per-agent sparkline of daily call volume when at least one agent has enough history.
By user
Anonymized by default. To protect individual privacy, this tab is empty until you explicitly opt out of anonymization by unchecking the Anonymized (aggregate only) control above the tabs. While anonymized, no per-user identifiers (email or user ID) are shown or exported; all other tabs (tenant, gateway, provider, model, channel, agent) and the activity counters remain fully populated. Unchecking the control reveals the per-user breakdown for your scope (a tenant administrator only ever sees their own tenant's users). The CSV export honours the same setting — while anonymized it writes an anonymized note row instead of any per-user rows.
When revealed, this tab includes only requests made with auth tokens that have a user_id set. Anonymous token requests are not shown.
| Column | Description |
|---|---|
| User | The user's email address (falling back to the user ID when no email is on file) |
| Requests | Total requests |
| Cost | Total cost in USD |
| Share | Proportional bar showing the share of total cost for this user |
| Cache | Cache hit rate (%) |
| Errors | Error rate; badge shown when errors > 0 |
| Blocked | Blocked request count; badge shown when > 0 |
| Avg Latency | Average end-to-end latency in milliseconds |
Exporting a breakdown
An Export CSV and an Export XLSX button at the right edge of the filter bar export the active tab. Both cover the current tab and period and honour the anonymization setting; the XLSX keeps numeric columns as real numbers (not text).
Proceed as follows to export a breakdown:
- Open the tab to export.
- Click on the Export CSV button (a
.csvfile) or the Export XLSX button (an.xlsxworkbook).
-> The active tab downloads as analytics-<tab>-<period>.csv or analytics-<tab>-<period>.xlsx.
💡 Note: The By User export honours the anonymization control: while anonymized, it writes an
anonymizednote row instead of any per-user rows. The other tabs contain no user identities and always export their full rows.
Tenant detail panel
Clicking any row in the By Tenant tab opens a slide-in panel on the right side of the screen with deeper detail for that tenant.
| Section | Content |
|---|---|
| Summary cards | Requests, Cost, Avg Latency for the selected period |
| Budget utilisation | Progress bar showing spend vs. configured budget (shown only when a budget is set) |
| Cost — Last 30 Days | Bar chart of daily cost over the past 30 days |
| Top Models | Table of models used by this tenant: Model, Provider, Requests, Cost, Avg Latency |
| Monthly Spend | Table of per-month spend going back up to 12 months |
| Anthropic Usage (API) | Anthropic API usage figures for the tenant over the selected period |
Proceed as follows to close the tenant detail panel:
- Click outside the panel or click the × button.
- The panel closes.
-> The tenant detail panel is closed.
See also
- Dashboard — live operations view with real-time metrics
- Budgets and quotas — configuring spend caps that appear in budget warnings
- Cost attribution — how costs are calculated
- Stats API