Request tracing
Gateway tracing records a step-by-step execution trace for each inference request. Each trace captures what happened at every stage of the request pipeline — model resolution, routing decisions, guardrail results, upstream calls, and the final response delivered to the client. Traces are linked to log entries via the trace_id field.
Tracing is opt-in and has no effect on request latency. All writes are fire-and-forget.
Enabling tracing
Proceed as follows to enable tracing on a gateway:
- Open the gateway in the admin UI.
- The gateway detail page appears.
- Click on the Edit button in the Gateway card header.
- The gateway configuration panel opens.
- Scroll to the Tracing section.
- Toggle the Enable request tracing control to on.
- If required, toggle Include message bodies in trace to record raw request content and web-search previews in the trace steps.
- Enable this for debugging only. It stores prompt text, response previews, and web-search queries in the trace table.
- When it is off (the default), these fields are omitted and the request and web-search steps record only metadata (message counts, body sizes, status).
- If required, set the Retention (hours) field. Note: this per-gateway value is stored but does not change how long traces are kept — trace retention is a single deployment-wide setting (default 48 hours); see Trace retention below.
- Click on the Save Changes button.
- The updated configuration is applied within seconds.
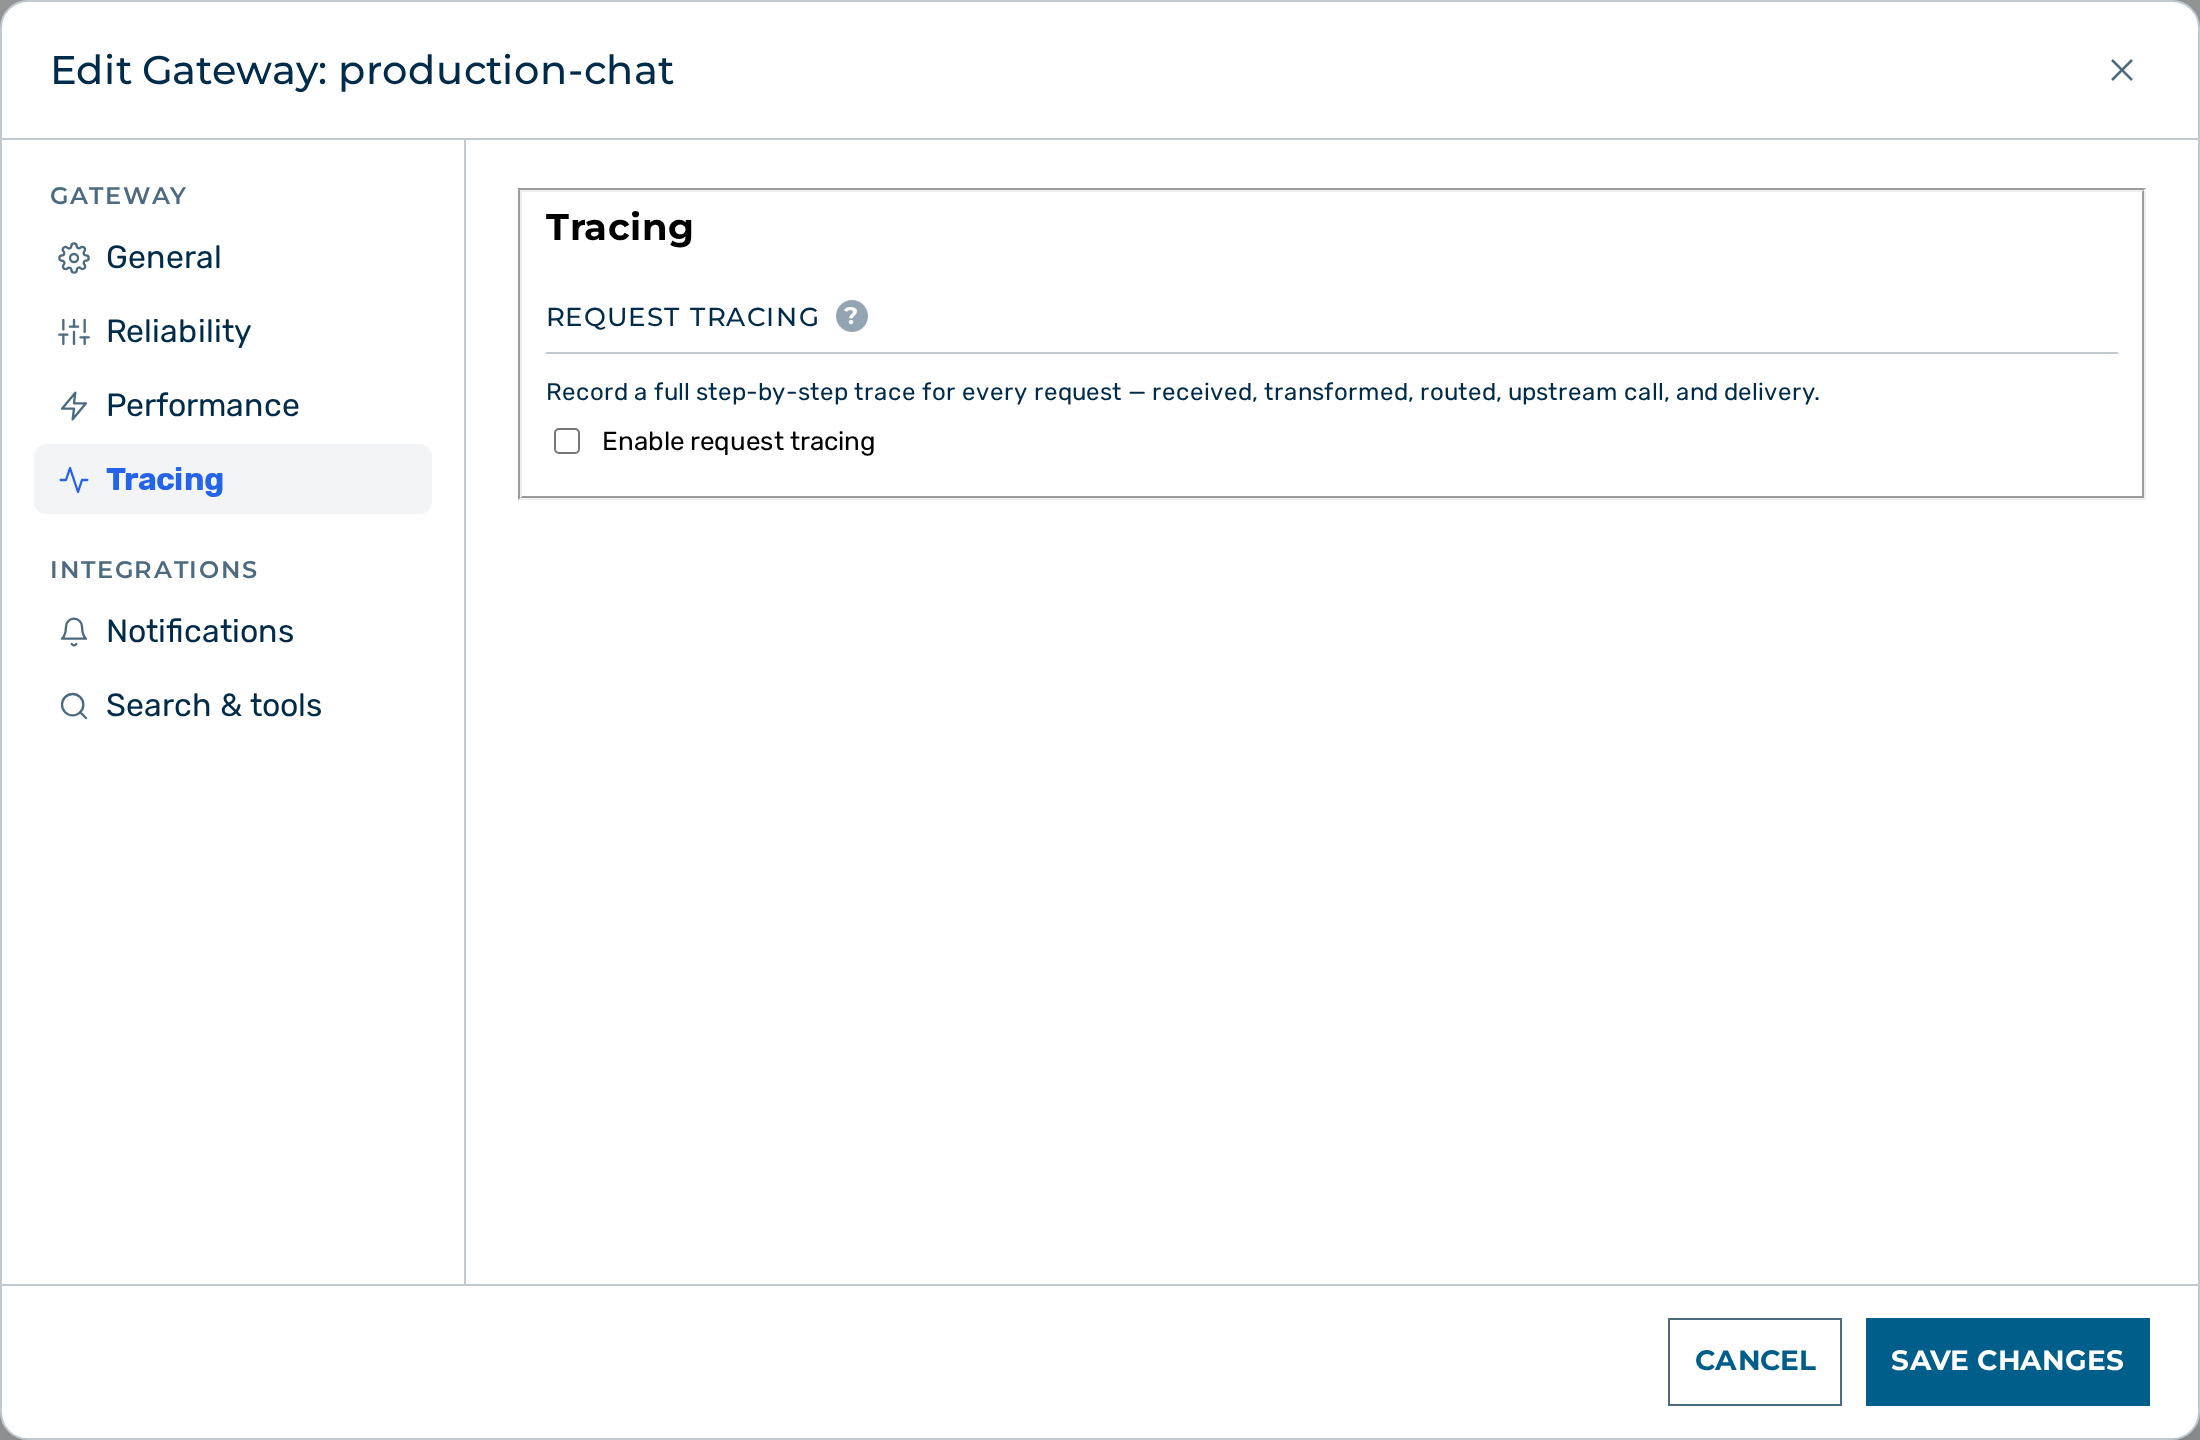 The Tracing section of the Edit Gateway dialog
-> Tracing is active for all subsequent requests through this gateway.
Alternatively, apply the configuration via the API:
curl -X PATCH https://<your-gateway-host>/admin/v1/gateways/{id} \
  -H "Content-Type: application/json" \
  -d '{"config": {"tracing": {"enabled": true}}}'
The full tracing configuration block:
| Field | Type | Default | Description |
|---|---|---|---|
enabled |
boolean | false |
Activates request tracing for this gateway. |
include_bodies |
boolean | false |
Includes raw content in these trace-step fields: the request message array (request_received, leg1_request, leg2_request), leg-1 response previews (leg1_response, leg1_direct_answer), web-search queries (search_result), the fetched URLs and page previews (fetch_attempt, fetch_result), the streamed model answer (leg2_response content/raw_content), tool-call arguments and result filenames (tool_call args, tool_result filename), and the raw model text and parsed filename captured by the dropped-tool guards (silent_write_file_drop raw_content/dropped_file, silent_tool_call_drop raw_content). Enable only for debugging — this stores prompt and response text in the trace table. When off, these fields are omitted and those steps record only metadata (counts, sizes, status). The Playground and agent-invoke trace paths never set this flag, so those fields stay metadata-only there. A private (ghost) conversation is always metadata-only regardless of this flag: its trace row is still written for operations and debugging (timestamps, model id, latency, token counts, status, tool/round metadata), but no prompt, response, tool argument, query, or preview content is persisted in it. |
Trace retention
Stored gateway traces are purged automatically, so the trace table does not grow without bound. Retention is deployment-wide, not per-gateway: a background job on the gateway deletes gateway traces older than the retention window once per hour.
The window is a deployment setting configured by your operator (default 48 hours, minimum 1). It is not part of a gateway's configuration.
Pipeline step reference
Steps are recorded in sequence order. Only steps that are reached for a given request appear in the trace. For example, a cached response does not produce upstream_request or upstream_response steps.
💡 Note: The steps below are the common ones a reader meets most often; the list is not exhaustive. The pipeline emits roughly thirty step types in total (retries, guardrail phases, tool-loop rounds, delegation, and more), and new steps are added as the pipeline grows.
request_received
Recorded immediately after the request body is parsed.
| Field | Description |
|---|---|
model |
Model name as received from the client (before normalisation). |
provider |
Provider resolved from the URL path. |
messages_count |
Number of messages in the request body. |
streaming |
Whether the client requested a streaming response. |
size_bytes |
Raw request body size in bytes. |
is_compat |
Whether the request arrived on the OpenAI-compatible endpoint. |
messages |
Full message array (only present when include_bodies: true). |
request_transformed
Recorded only when the model or provider changes during normalisation (e.g. compat endpoint provider inference, provider-prefix stripping).
| Field | Description |
|---|---|
model_before |
Model name before normalisation. |
model_after |
Model name after normalisation. |
provider_before |
Provider before normalisation. |
provider_after |
Provider after normalisation. |
routing_applied
Recorded when a routing rule matches and changes the provider or model.
| Field | Description |
|---|---|
rule_id |
ID of the matched routing rule. |
provider_before |
Provider before routing. |
model_before |
Model before routing. |
provider_after |
Provider after routing. |
model_after |
Model after routing. |
guardrail_result
Recorded after the guardrail pipeline completes.
| Field | Description |
|---|---|
verdict |
"safe", "unsafe", or the guardrail verdict string. |
blocked |
true if the request was blocked. |
detector |
Name of the detector that fired (if blocked). |
latency_ms |
Time spent in the guardrail pipeline. |
upstream_request
Recorded immediately before each upstream provider call.
| Field | Description |
|---|---|
attempt |
Attempt number (1 = first try). |
provider |
Provider being called. |
model |
Model being called. |
url |
Request URL sent to the provider (auth key stripped). |
upstream_response
Recorded after each upstream provider response is received.
| Field | Description |
|---|---|
attempt |
Attempt number. |
provider |
Provider that responded. |
status |
HTTP status code. |
latency_ms |
Time between upstream request and response. |
input_tokens |
Prompt tokens from the provider usage object. |
output_tokens |
Completion tokens from the provider usage object. |
upstream_error
Recorded when an upstream call fails with a network error (not an HTTP error response).
| Field | Description |
|---|---|
attempt |
Attempt number. |
provider |
Provider that failed. |
error |
Error message string. |
response_delivered
Recorded after the response is sent to the client.
| Field | Description |
|---|---|
streaming |
Whether the response was streamed. |
provider_status |
HTTP status code from the upstream provider. |
body_size |
Response body size in bytes (non-streaming). |
compat |
Whether the response was re-encoded for the compat endpoint. |
Web search steps
These steps appear when web search is enabled on the gateway.
| Step | Description |
|---|---|
leg1_request |
First inference call to extract search queries. Records messages_count/tools_count; the raw messages/tools only when include_bodies is on. |
leg1_response |
Response from the first call. Records status/body_len; the raw body_preview only when include_bodies is on. |
leg1_direct_answer |
Recorded when the model answers directly without triggering a search. Records body_len; the raw body_preview only when include_bodies is on. |
search_result |
Queries sent and snippets returned from the search provider. Records queries_count and per-result sizes/URLs; the raw queries only when include_bodies is on. |
fetch_attempt |
URLs selected for full-page fetching. Records url_count; the raw urls only when include_bodies is on. |
fetch_result |
Fetch outcome for each URL. Records ok/text_len; the raw url and page preview only when include_bodies is on. |
leg2_request |
Second inference call with search context injected. Records messages_count; the raw messages only when include_bodies is on. |
leg2_response |
Final response from the second call. Records content_len (and raw_len when the relay changed the text); the raw content/raw_content only when include_bodies is on. |
Tool execution steps
These steps appear when the model calls a tool (for example the code interpreter) during an agentic turn.
| Step | Description |
|---|---|
tool_call |
One tool invocation the model requested. Records round/tool; the raw args only when include_bodies is on. |
input_files_staged |
Code-interpreter data-file staging outcome. Records requested/staged/notes counts only — filenames and bytes are never stored in the trace. notes counts drop notes, not files: one note can cover several requested files, so requested is not necessarily staged plus notes. |
tool_result |
The result returned to the model. Records round/tool/chars; the produced filename only when include_bodies is on. |
loop_terminated |
The agentic loop ended early. Records the termination reason and its details. |
RAG ranking step
This step appears when the model calls the knowledge-search tool.
| Step | Description |
|---|---|
rag_rank |
Retrieval ranking for one knowledge-search call, including the optional cross-encoder rerank stage. Records mode (dormant when no reranker is configured, reranked when the reranker reordered the results, or fallback when a configured reranker was unavailable and the fused order was kept), configured (whether a reranker model is set), fused_n (candidate passages after hybrid fusion), kept (passages served after any rerank trim), and sent (passages sent to the reranker). The ranked document identifiers (order) only when include_bodies is on. |
Linking traces to log entries
When gateway tracing is enabled, each log entry contains a trace_id field. Use it to retrieve the full execution trace.
Proceed as follows to retrieve the trace for a log entry:
- Fetch the log entry to obtain the
trace_id.
-
The response contains a
trace_idfield, for example"trc_abc123". -
Fetch the full trace using the
trace_id.
-> The full execution trace for the request is returned.
💡 Note:
trace_idisnullin log entries when tracing was not active for that request.
Playground requests always produce traces regardless of the gateway tracing config. Playground traces have source: "playground" and are accessible via the same GET /traces/{id} endpoint.
Configuring OTLP export
The gateway exports distributed traces as OpenTelemetry Protocol (OTLP) spans to any OpenTelemetry-compatible backend — Jaeger, Grafana Tempo, Datadog, Honeycomb, and others. OTLP export is independent of the internal pipeline trace described above.
W3C traceparent propagation
The gateway reads an incoming traceparent header from the client (if present) and propagates the trace context to upstream LLM providers. This allows end-to-end trace correlation across your services, the gateway, and the provider. When the gateway initialises tracing for a request — whether from an incoming traceparent or by generating new IDs — it injects a traceparent header into the upstream provider request.
OTLP/HTTP span export
After each request, the gateway emits a root span (SERVER) and, when an upstream call was made, a child span (CLIENT) to your OTel collector. Delivery is fully asynchronous and never adds latency.
Configuration
Add otlp_endpoint to your existing tracing block:
{
  "tracing": {
    "enabled": true,
    "otlp_endpoint": "http://otel-collector:4318",
    "service_name": "ai-gateway",
    "headers": {},
    "sample_rate": 1.0,
    "include_bodies": false
  }
}
| Field | Type | Default | Description |
|---|---|---|---|
enabled |
boolean | false |
Activates internal pipeline tracing |
otlp_endpoint |
string | — | Base URL of your OTel collector, e.g. http://otel-collector:4318. Setting this enables OTLP export. |
service_name |
string | ai-gateway |
service.name resource attribute on all emitted spans |
headers |
object | {} |
Extra HTTP headers to include in the OTLP request (e.g. auth tokens for managed collectors) |
sample_rate |
number | 1.0 |
Fraction of requests to export (0.0 = never, 1.0 = always) |
include_bodies |
boolean | false |
When true, adds aig.request_size_bytes to spans |
💡 Note:
enabled: truealone activates only the internal pipeline trace (playground / Traces API). Settingotlp_endpointenables OTLP export and implies tracing is active for that gateway — export runs onotlp_endpointindependently ofenabled, so a gateway can export spans withenabled: false.💡 Note: The four OTLP-export fields (
otlp_endpoint,service_name,headers,sample_rate) are configured via the Admin API and have no control in the gateway Edit dialog. The dialog exposes onlyenabled/include_bodies/ retention, and preserves the OTLP fields untouched on save — editing an unrelated gateway setting never wipes your export configuration, and toggling "enable tracing" off in the dialog does not stop OTLP export (removeotlp_endpointvia the API to do that).
Span model
Each exported trace contains up to two spans:
| Span | Kind | When emitted | Name |
|---|---|---|---|
| Root span | SERVER (2) | Every request | inference |
| Upstream span | CLIENT (3) | Only when an upstream LLM call was made | upstream.<provider> |
The parentSpanId of the upstream span is the spanId of the root span, forming a parent-child relationship.
Root span attributes (GenAI semantic conventions)
| Attribute | Type | Description |
|---|---|---|
gen_ai.system |
string | LLM provider (openai, anthropic, …) |
gen_ai.request.model |
string | Model name |
gen_ai.usage.input_tokens |
integer | Prompt token count |
gen_ai.usage.output_tokens |
integer | Completion token count |
gen_ai.request.cost_usd |
double | Estimated inference cost |
http.status_code |
integer | HTTP status returned to the client |
aig.tenant_id |
string | Tenant identifier |
aig.gateway_id |
string | Gateway identifier |
aig.cached |
boolean | Whether the response came from cache |
aig.blocked |
boolean | Whether the request was blocked |
aig.blocked_by |
string | Block reason category (when blocked) |
aig.upstream_attempts |
integer | Provider dials attempted (emitted when > 0) |
Upstream span attributes
| Attribute | Type | Description |
|---|---|---|
gen_ai.system |
string | Provider |
gen_ai.request.model |
string | Model |
http.status_code |
integer | Provider HTTP status |
aig.upstream_latency_ms |
integer | Provider round-trip latency |
aig.upstream_attempts |
integer | Retry count |
aig.fallback_provider |
string | Fallback provider (when failover occurred) |
aig.fallback_model |
string | Fallback model (when failover occurred) |
Sampling
Use sample_rate to reduce export volume for high-traffic gateways:
This exports roughly 10 % of requests. Sampling is applied at export time, after the request completes: when the random draw exceeds sample_rate, the export is skipped and no span is built at all — nothing is assembled and then discarded. There is no head-based sampling; every request processes normally.
Configuration examples
The following examples show how to configure OTLP export for common backends.
Jaeger (all-in-one)
Grafana Tempo
Datadog OTLP endpoint
{
  "tracing": {
    "otlp_endpoint": "http://datadog-agent:4318",
    "headers": { "DD-API-KEY": "your-api-key" },
    "service_name": "ai-gateway"
  }
}
Honeycomb
{
  "tracing": {
    "otlp_endpoint": "https://api.honeycomb.io",
    "headers": { "x-honeycomb-team": "your-api-key" },
    "service_name": "ai-gateway"
  }
}