Dashboard
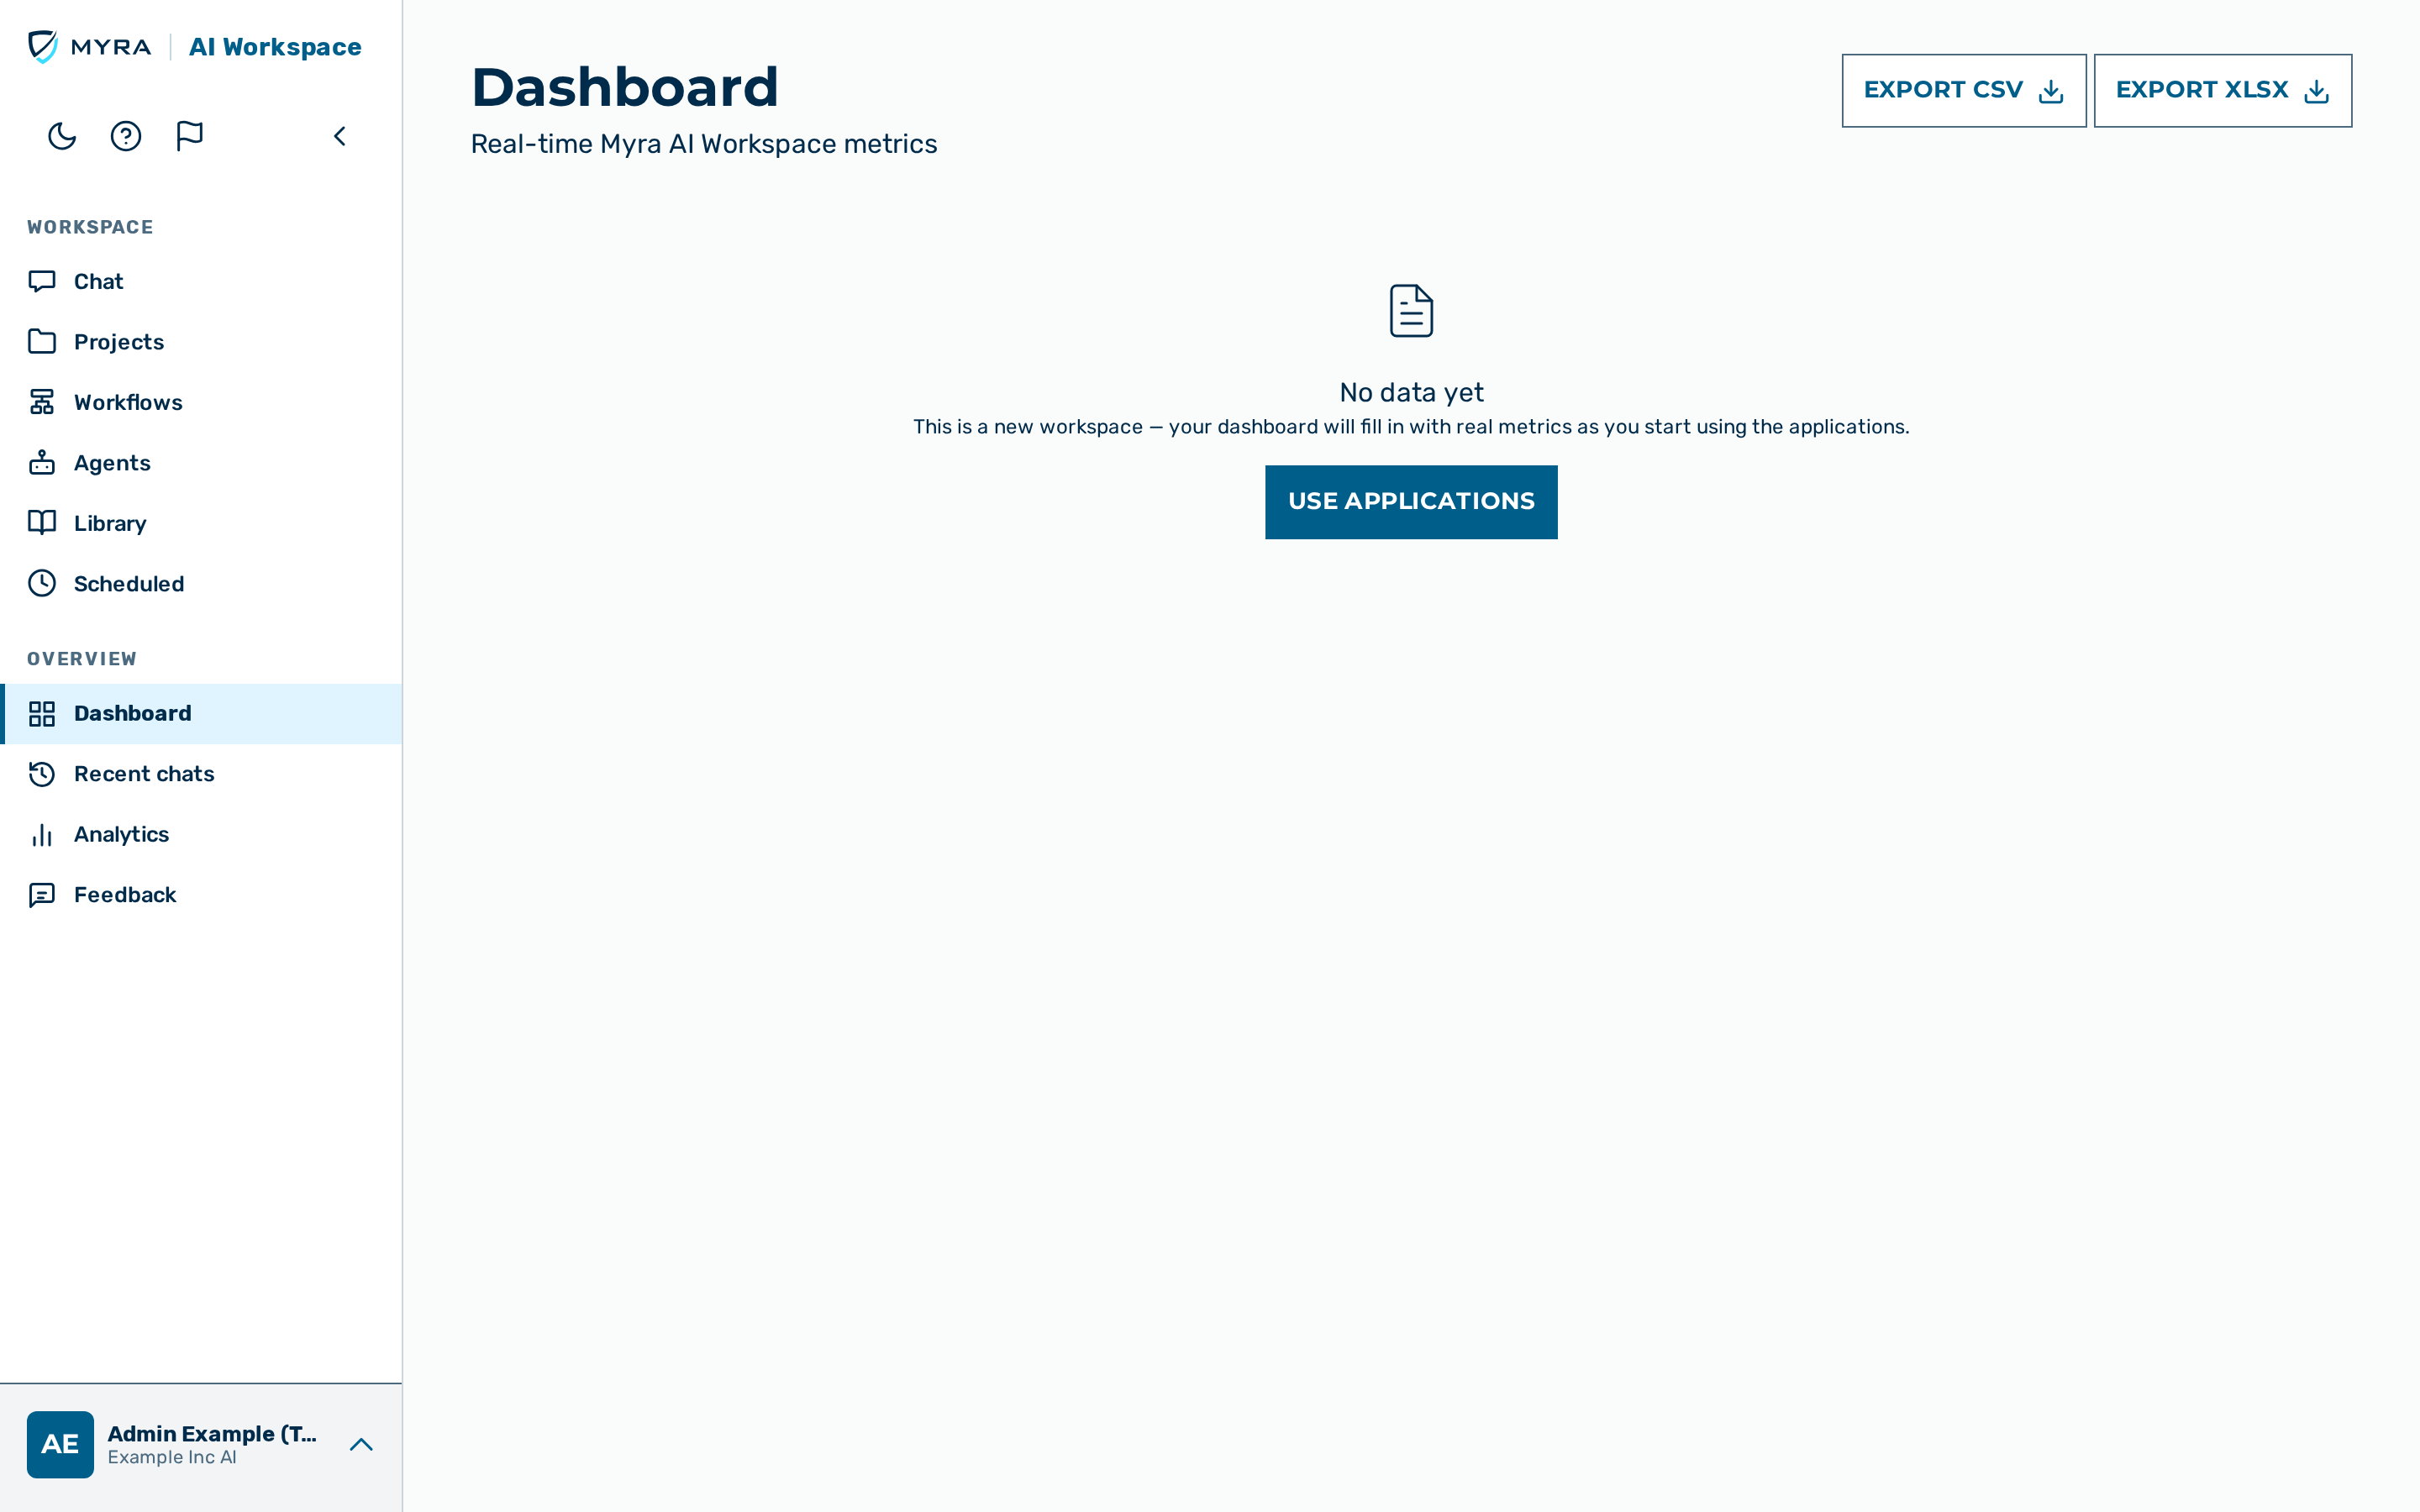 The dashboard showing hero cards, timeframe selector, usage tables, and recent events.
The Dashboard is the first entry of the Overview cluster (/dashboard) and the screen admins, tenant admins, and KI-Managers land on after signing in. It provides a live operations view of gateway activity: request volume, cost, guardrail hits, recent traffic, and recent blocked events.
💡 Note: A brand-new workspace with no traffic yet shows a "No data yet" empty state instead of empty charts, until the first requests are recorded.
Timeframe selector
The top of the hero section contains a row of timeframe tab buttons. Selecting a timeframe updates the values of the hero cards and the sparklines for that window.
| Option | Window |
|---|---|
| Today | From your local calendar midnight to now |
| Yesterday | The previous calendar day |
| Last 7 days | Rolling 7-day window |
| Last hour | Rolling 60-minute window |
| Last minute | Rolling 60-second window |
Hero cards
Three cards summarise the selected timeframe at a glance. Each card includes a sparkline chart of the underlying timeseries.
| Card | Primary metric | Sub-metric |
|---|---|---|
| Requests | Total request count | Cache hit rate (%) |
| Cost | Cumulative cost | Cost saved via cached responses |
| Guardrail Hits | Total guardrail activations | Breakdown: blocked · scrubbed · flagged |
💡 Note: The dashboard shows costs in your Display currency preference — euros or US dollars — set under Settings › Preferences. Amounts are metered in US dollars; euro figures are an approximate conversion at the daily reference rate. Cost analytics and the Live monitor have their own Currency selector in the page header.
Input Token Caching Efficiency
This card is shown below the main hero cards only when the selected timeframe has both cache-read and cache-write activity (a prompt-caching provider such as Anthropic was used). A period with only non-cached input — for example local myra-fleet models, which do not cache — hides the card rather than showing a 0 % hit rate.
| Section | Description |
|---|---|
| Hit rate bar | Percentage of input tokens served from cache, colour-coded: green (≥ 60 %), amber (≥ 30 %), red (< 30 %) |
| Served from cache (reads) | Token count, percentage of total input tokens, and cost at the 0.1× cache-read rate |
| Processed fresh (cache writes) | Token count, percentage of total input tokens, and cost at the 1.25× cache-write rate |
| New tokens (not cached) | Token count, percentage of total input tokens, and cost at the standard 1× input rate |
| Cost summary | Total cached input cost · total uncached input cost · compaction savings (if any) |
Usage by tenant
The Usage by Tenant table shows per-tenant activity for the selected timeframe. It is visible only when at least one request exists in the period, and is hidden from users without a management or admin role (the member, viewer, ki_manager, and finance-only or unroled users).
| Column | Description |
|---|---|
| Tenant | Tenant slug |
| Requests | Total requests |
| Input Tokens | Total input tokens consumed |
| Output Tokens | Total output tokens consumed |
| Cost | Total cost |
Top models
The Top Models table lists up to five models ordered by request count for the selected timeframe.
| Column | Description |
|---|---|
| Provider | Provider slug |
| Model | Model name |
| Requests | Total requests to this model |
| Cost | Total cost |
| Avg Latency | Average end-to-end latency in milliseconds |
Recent requests
The Recent Requests table shows the last 10 requests across all gateways.
| Column | Description |
|---|---|
| Time | Timestamp |
| Tenant | Tenant slug |
| Gateway | Gateway slug |
| Provider | Provider that handled the request |
| Model | Model name |
| Status | HTTP status code badge |
| Tokens | Input and output token counts (in+out) |
| Cost | Estimated cost |
| Latency | End-to-end latency in milliseconds |
| Flags | cached, blocked, or rate limited badges where applicable |
Recent guardrail events
The Recent Guardrail Events table shows the most recent blocked requests. It is visible only when blocked events exist, and is hidden from users without a management or admin role (the member, viewer, ki_manager, and finance-only or unroled users).
| Column | Description |
|---|---|
| Time | Timestamp |
| Tenant | Tenant slug |
| Gateway | Gateway slug |
| Outcome | The guardrail outcome |
| Detector | Detector that produced the outcome |
| Reason | Block reason string |
| Latency | End-to-end request latency in milliseconds (not the guardrail-evaluation time; the Dashboard renders the request latency in this column) |
💡 Note: The dashboard does not auto-refresh; reload the page to pull the latest data. Use the Export CSV or Export XLSX button at the top right to download the current view as a
.csvfile or an.xlsxworkbook.
Member reactivation
Platform admin only. When you hold the platform admin role, the dashboard shows a member-reactivation roll-up card below the hero cards. The card reports the reactivation e-mails sent in the last 7 and 30 days, how many members reactivated, the opt-outs, and the ten most-mailed workspaces. The same card appears for a single tenant at the top of Cost analytics, where it is visible to admin and tenant_admin. See Reactivation e-mails for the cadence and the per-tenant controls.
See also
- Cost analytics — spend breakdown by tenant, gateway, provider, model, and user
- Request logging
- Request tracing
- Stats API