Request logging
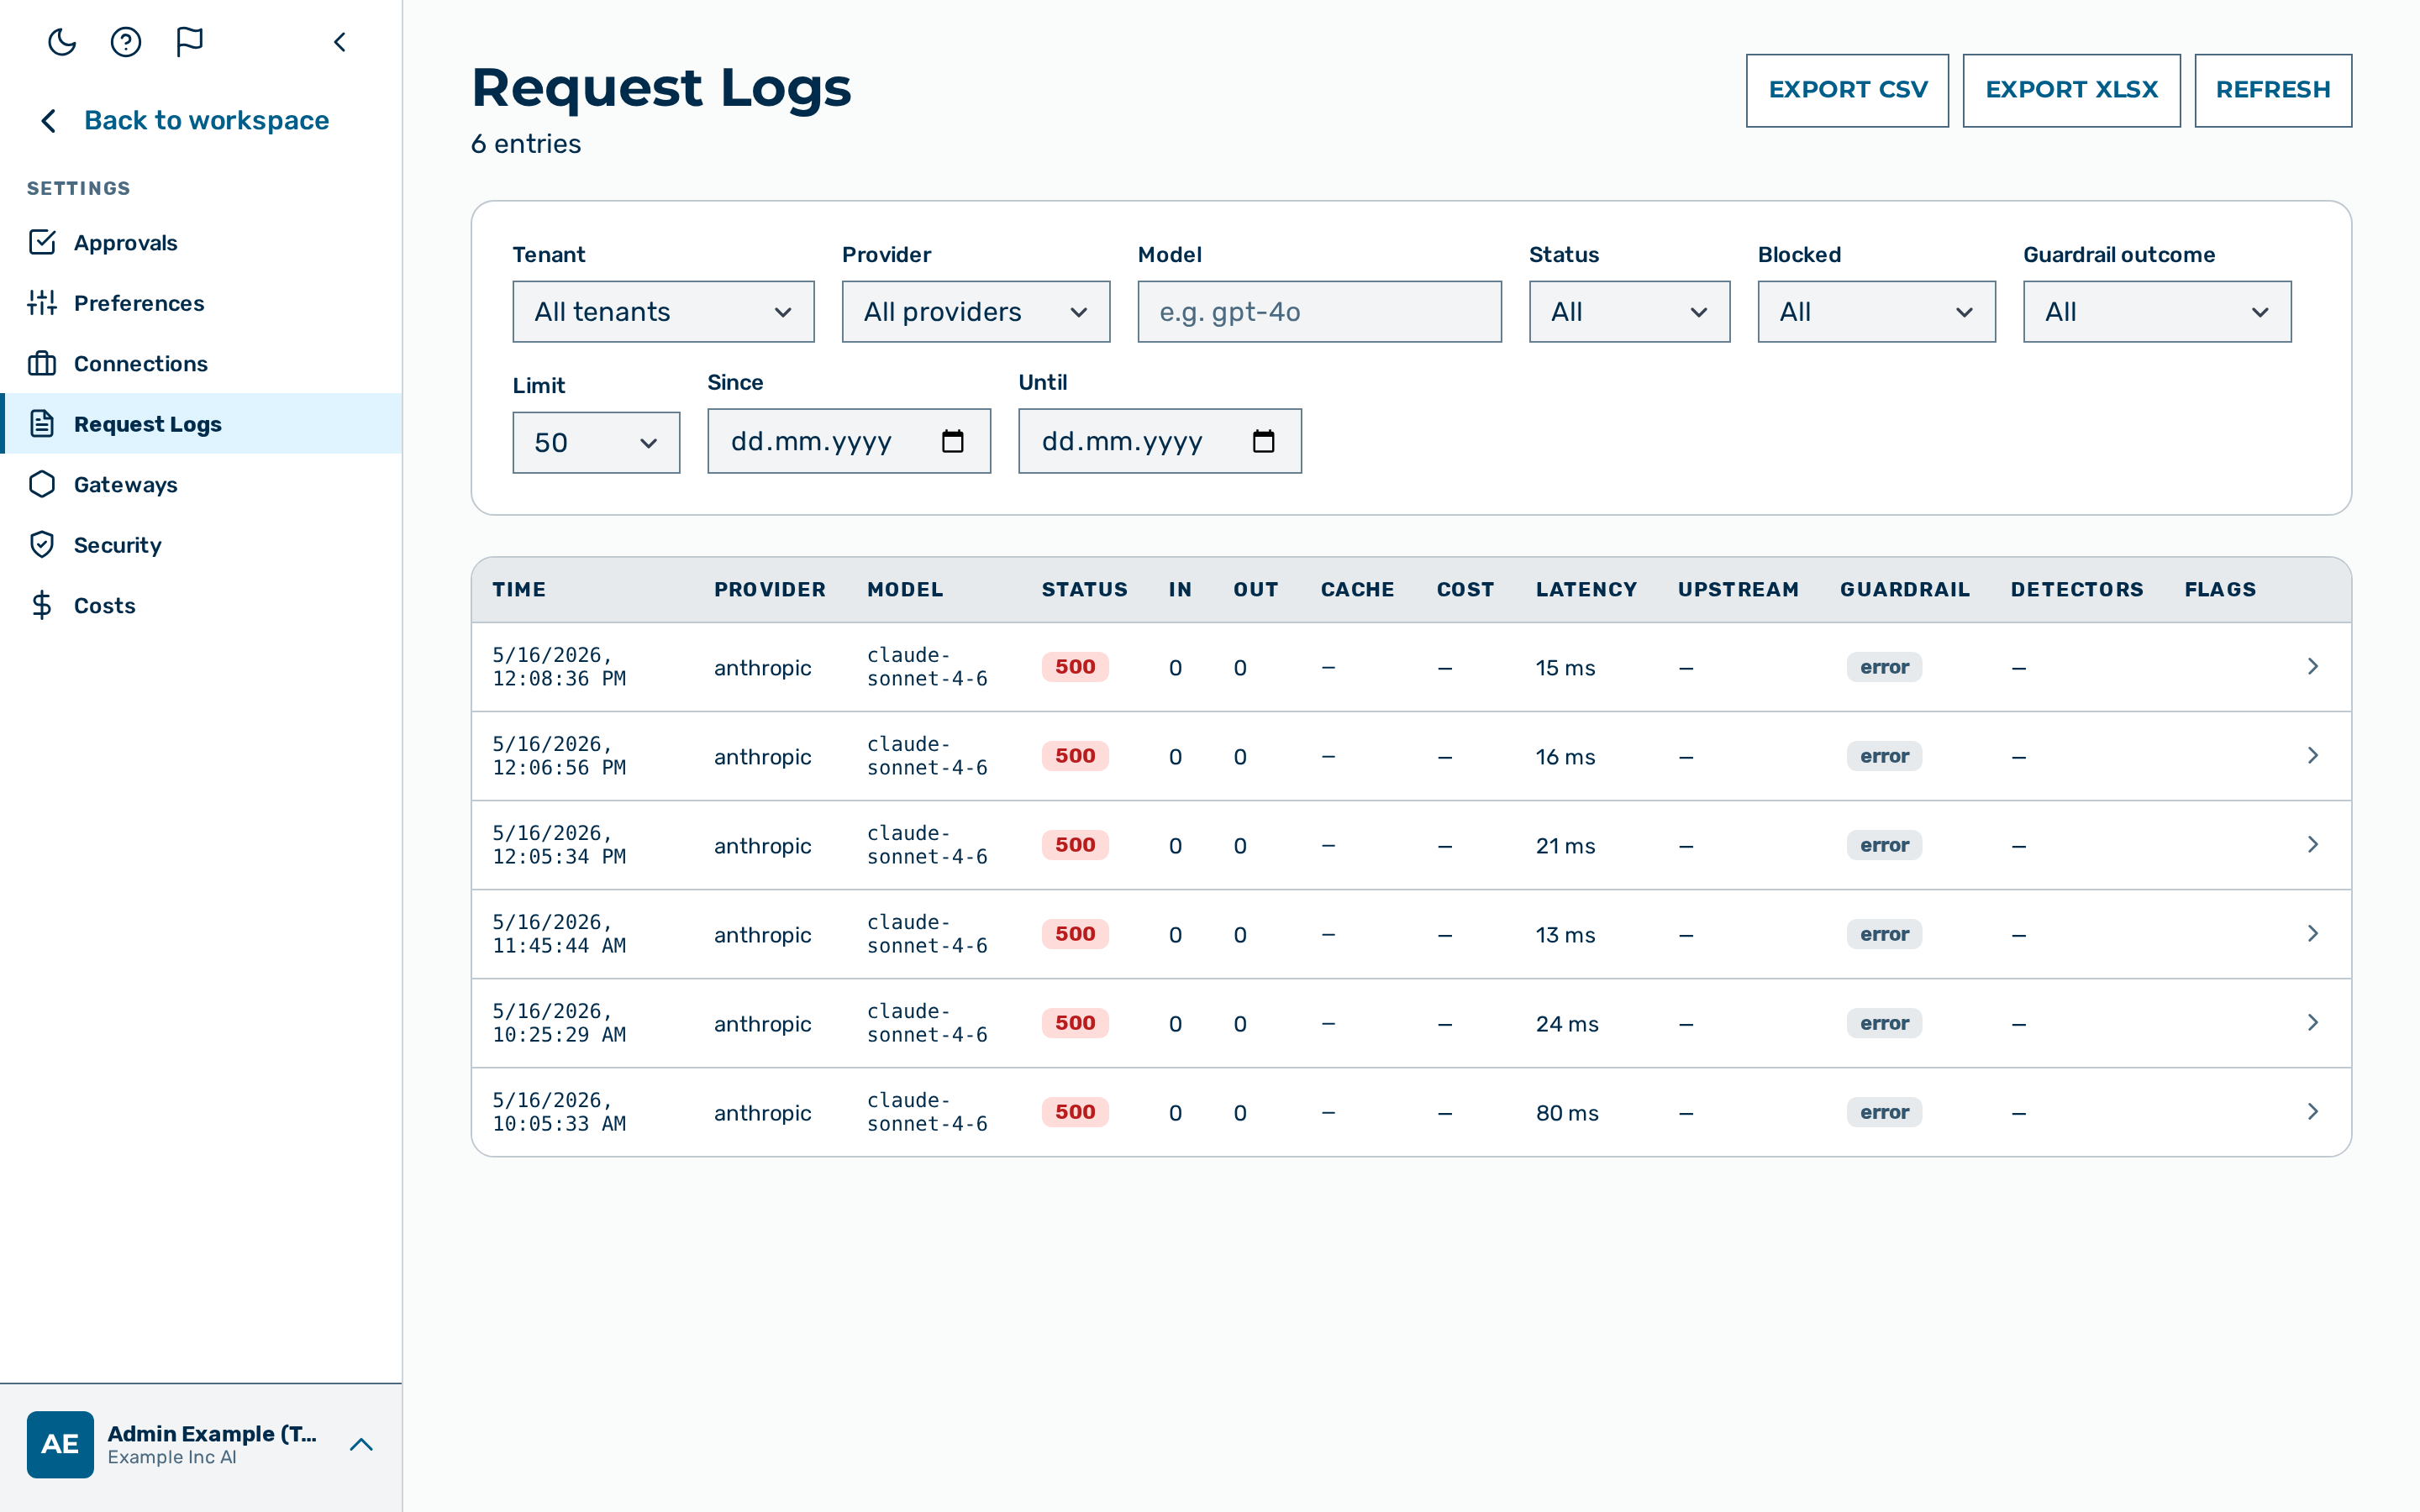 The request log table in the admin UI, showing per-request identity, routing, status, and cost fields.
Myra AI Workspace captures a structured log entry for every inference request. Each entry records the provider used, token counts, cost, latency, cache status, and — optionally — the full prompt and response text. View logs in real time in the admin UI under Logs, or query them via the API.
Logging happens after the response is sent. It adds no latency to the request path.
Log entry fields
Identity
| Field | Type | Description |
|---|---|---|
id |
string | Unique request ID (UUID) |
ts |
unix seconds | Event timestamp. The request_log.ts column is stored in milliseconds; the API projects ROUND(ts / 1000), so the returned value is in seconds. |
tenant_id |
string | Tenant that owns this gateway |
gateway_id |
string | Gateway through which the request was routed |
user_id |
string | null | User ID extracted from the auth token |
token_label |
string | null | Human-readable label of the auth token used |
Routing
| Field | Type | Description |
|---|---|---|
provider |
string | Provider that handled the request (e.g. openai, anthropic) |
model |
string | Model name as sent in the request |
fallback_provider |
string | null | Provider used if the primary provider failed |
fallback_model |
string | null | Model used on the fallback attempt |
upstream_attempts |
integer | Provider dials attempted for this turn. 1 = answered first try, >1 = retries/fallbacks were used, 0 = no provider was ever dialled (refused before dispatch). Failed dials are counted from a later release on; rows written before that release record 0 even when dials occurred. |
Status
| Field | Type | Description |
|---|---|---|
status |
integer | HTTP status code returned to the caller |
aborted |
integer | 1 if the client cancelled the request mid-generation (e.g. pressing Stop), 0 otherwise. Its purpose is to separate a cancel from a genuine empty completion among status 200 rows: a post-header stream cancel is status 200 with zero token counts (the provider never returned a usage block) and aborted 1, whereas a real empty answer is status 200, output_tokens 0, aborted 0. A cancel detected before the response was streamed lands as status 499, and may also carry aborted 1 (a buffered-collect cancel sets both); those 499 rows are already counted by the client_aborted stats metric, so the empty-vs-cancel distinction only needs aborted on the status 200 rows. Stored on the row and queryable via SQL/ClickHouse, but not returned by the logs API or shown in the log viewer (like saved_latency_ms and time_to_first_token_ms). |
blocked |
integer | 1 if the request was blocked by a detector or guardrail, 0 otherwise |
blocked_by |
string | null | Name of the detector or rule that blocked the request |
block_reason |
string | null | Human-readable block reason |
rate_limited |
integer | 1 if the request was rejected by a rate limit, 0 otherwise |
Cache
| Field | Type | Description |
|---|---|---|
cached |
integer | 1 if the response was served from cache, 0 otherwise |
saved_cost_usd |
number | null | Cost saved by serving from cache |
💡 Note:
saved_latency_msis stored on the request-log row but is not returned by the logs API — the projection omits it.
Tokens
| Field | Type | Description |
|---|---|---|
input_tokens |
integer | Prompt tokens consumed |
output_tokens |
integer | Completion tokens generated |
cache_creation_tokens |
integer | null | Tokens written to Anthropic prompt cache |
cache_read_tokens |
integer | null | Tokens read from Anthropic prompt cache |
cache_deletion_tokens |
integer | null | Tokens evicted from the Anthropic prompt cache |
Cost
| Field | Type | Description |
|---|---|---|
cost_usd |
number | null | Estimated cost in USD, computed from the prices table |
Timing
| Field | Type | Description |
|---|---|---|
latency_ms |
integer | Total request latency from gateway receipt to response sent |
upstream_latency_ms |
integer | null | Time spent waiting for the upstream provider |
💡 Note:
time_to_first_token_ms(time to first SSE token, streaming requests only) is stored on the request-log row but is not returned by the logs API — the projection omits it.
Payload
| Field | Type | Description |
|---|---|---|
prompt |
string | null | Full prompt text (null if log_payloads: false or suppressed per-request). Inline binary — base64 attachment bytes — is never stored: it is replaced by [binary omitted: N bytes], leaving the block type and media type visible. See the Logs API for the exact rule. |
response |
string | null | Full response text (null for streaming requests, or if payload logging is off) |
Detectors
| Field | Type | Description |
|---|---|---|
detectors_fired |
array of strings | Names of the detectors that fired for this request (empty array when none fired) |
scrub_applied |
integer | 1 if PII scrubbing (masking) was applied to this request, 0 otherwise |
Guardrail
| Field | Type | Description |
|---|---|---|
guardrail_verdict |
string | null | The guardrail pipeline verdict for this request. Omitted when metadata_only is set. |
guardrail_latency_ms |
integer | null | Time spent in the guardrail pipeline |
Stream
| Field | Type | Description |
|---|---|---|
is_streaming |
integer | 1 if the response was streamed (SSE), 0 otherwise |
api_variant |
string | null | API surface the request used (for example the Chat Completions or Messages variant) |
Client
| Field | Type | Description |
|---|---|---|
client_ip |
string | null | Source IP of the caller |
user_agent |
string | null | User-Agent header of the request |
referer |
string | null | Referer header of the request |
request_size_bytes |
integer | null | Size of the request body in bytes |
Custom metadata
| Field | Type | Description |
|---|---|---|
meta |
object | The guardrail protection markers for this request — see Protection markers. Always carries at least guardrail_gap. Under metadata_only it carries the boolean markers but not guardrail_error. |
⚠️ What is stored and what is returned are not the same set. The
metacolumn onrequest_logholds thex-aig-meta-*key/value map from the request headers plus the gateway-owned diagnostic keys listed below. Themetafield returned byGET /logsandGET /logs/{id}is a curated subset: the guardrail protection markers only. The keys below are reachable by direct SQL (JSON_EXTRACT(meta, '$.<key>')), not through the API.
The aig* key space inside meta is reserved for the gateway: an x-aig-meta-aig…
request header is dropped, never stored, so these keys are always gateway-authored.
stored meta key |
Meaning |
|---|---|
aig_stream_error |
A typed error was delivered as an SSE frame on an already-open stream (so the wire status was 200 while status records the real one, e.g. 403). |
aig_no_dispatch |
Invariant tripwire: a streaming turn ended having dispatched to no provider and recorded no reason. Always a gateway defect — the matching [no_dispatch] line is at ERR in the error log. |
aig_mcp_policy_dropped |
MCP connector references were dropped because the project forbids external egress. |
aig_prompt_binary_stripped |
The number of inline-binary payloads (base64 attachment bytes) replaced by [binary omitted: N bytes] in this entry's prompt. Absent when nothing was replaced. Gateway-owned (aig_ prefix — a client x-aig-meta-* header cannot set it). See the Logs API. |
aig_payload_truncated |
The payload columns (prompt, response, response_raw, prompt_scrubbed) that were cut to fit the entry's 12 MiB payload budget, as an array of column names. Absent when nothing was cut. Gateway-owned. See the Logs API. |
threat_taxonomy |
Present only on a guardrail-blocked/flagged request: the OWASP-LLM-Top-10 category ids and MITRE-ATLAS technique ids classified from this request's guardrail verdict ({ "owasp": [...], "atlas": [...] }). See the compliance crosswalk. |
aig_meta_truncated |
The meta column exceeded its storage cap and was truncated: some keys were dropped. Also returned by the API as a protection marker — and it counts as a guardrail gap, because every other marker on such a row is unknown rather than false, and guardrail_gap: false is a positive statement that the request was protected. |
spend_read_degraded |
A budget scope's spend could not be read (database failure). The budget hard stop then failed open for THAT scope (request allowed; that scope's cap was not enforced for it — the turn is still metered at turn end, so an outage can leave spend under-counted, never over-counted) and the soft alert was skipped — see Budgets. |
Querying request logs
Proceed as follows to query request logs via the API:
- Send a
GETrequest to/admin/v1/logswith an admin token. - The endpoint accepts the following query parameters:
| Parameter | Description |
|---|---|
limit |
Number of entries to return (default: 50, maximum 200) |
offset |
Pagination offset |
tenant_id |
Filter by tenant |
gateway_id |
Filter by gateway |
provider |
Filter by provider name |
model |
Filter by model name |
status |
Filter by HTTP status code |
blocked |
Set to 1 to return only blocked requests |
guardrail_outcome |
Filter by guardrail outcome: blocked, scrubbed, flagged, degraded, compliance, or any. degraded selects the requests that reached a provider without the protection they were configured to get; compliance selects only the incidents where unmasked personal data actually left the estate; any matches either kind. |
since |
Start of the time range, as a numeric Unix timestamp in milliseconds. Only entries with ts >= since are returned. When guardrail_outcome=degraded and no since is given, it defaults to 30 days ago — that filter reads the meta markers, which no index can serve. An explicit since is always honoured, and the console pre-fills the From date so the window is visible. |
until |
End of the time range, as a numeric Unix timestamp in milliseconds. Use with since for a date range. |
metadata_only |
Set to 1 to omit the content columns from each entry (the prompt and the response among them) for a bulk export. The meta protection markers stay — see metadata_only in the API reference for the exact set of withheld fields. |
- If filtering blocked requests, add
blocked=1to the query string. - If filtering by time range, add the
sinceanduntilparameters as Unix timestamps in milliseconds. - The API returns a paginated list of log entries matching the filter.
⭐ Example:
# Last 10 blocked requests
curl "https://gateway.example.com/admin/v1/logs?blocked=1&limit=10" \
  -H "Cookie: aig_admin=<SESSION>"

# Requests for a specific gateway since a given time (Unix ms)
curl "https://gateway.example.com/admin/v1/logs?gateway_id={id}&since=1735732800000" \
  -H "Cookie: aig_admin=<SESSION>"
-> The API returns a paginated list of log entries matching the specified filters.
Exporting from the console
The Request logs page's Export CSV / Export XLSX buttons download the currently
filtered entries (the Since/Until window, and every other active filter) as a
request-logs-<date>.csv / .xlsx file. The export is metadata only — it is fetched with
metadata_only=1, so no prompt, response, or other message content ever appears in it — and is
capped at 20,000 rows (the page says so when the cap cut an export short). The columns, in order:
ID, Timestamp (UTC) (ISO 8601), Tenant, Gateway, Provider, Model, Status,
Blocked, Blocked By, Input Tokens, Output Tokens, Cost (USD), Latency (ms),
Upstream Latency (ms), Guardrail Latency (ms), Scrubbed, Detectors (|-separated
detector names), Protection Gap (1 when the request reached a provider without the
protection it was configured to get, else 0 — the guardrail_gap marker), Gap Severity
(compliance or degraded when there is a gap, otherwise empty — the guardrail_gap_severity
marker), Rate Limited, Trace ID, Client Request ID (the caller's own X-Request-Id, when it sent a conforming one — see the Logs API; empty otherwise).
The two protection columns are the markers an auditor filters the page by (Guardrail outcome → degraded / compliance); without them an export selected by those filters would say nothing about why its rows were selected. They are booleans and an enum — the failing detector's name stays server-side.
Enabling payload logging
Payload logging is controlled at two levels: per-gateway and per-request.
Disabling payload logging at gateway level
Proceed as follows to disable payload storage for all requests through a gateway:
- Send a
PATCHrequest to/admin/v1/gateways/{id}with thelog_payloadsfield set tofalse.
curl -X PATCH "https://gateway.example.com/admin/v1/gateways/{id}" \
  -H "Cookie: aig_admin=<SESSION>" \
  -H "Content-Type: application/json" \
  -d '{"config": {"log_payloads": false}}'
- The
promptandresponsefields are set tonullfor every subsequent request through that gateway.
-> The gateway no longer stores prompt or response text in log entries.
Suppressing payloads per request
Proceed as follows to suppress payload logging for individual requests:
- Include the
x-aig-collect-log-payloadheader set tofalsein the client request.
# Log metadata but not the prompt/response text
curl -s -X POST "https://gateway.example.com/v1/myapp/prod/openai/chat/completions" \
  -H "x-aig-collect-log-payload: false" \
  ...
-
The log entry is written with metadata only;
promptandresponseare set tonull. -
If you want to skip the log entry entirely, include
x-aig-collect-log: falseinstead.
# Skip logging entirely
curl -s -X POST "https://gateway.example.com/v1/myapp/prod/openai/chat/completions" \
  -H "x-aig-collect-log: false" \
  ...
- No log entry is written for this request.
-> The specified request is either logged without payload text, or not logged at all.
⚠️ Caution:
x-aig-collect-log-payload: falseonly suppresses payloads for the single request that includes the header. It does not change the gateway-levellog_payloadssetting.
Attaching custom metadata
Any request header prefixed with x-aig-meta- is captured in the meta column of the log entry:
curl -s -X POST "https://gateway.example.com/v1/myapp/prod/openai/chat/completions" \
  -H "x-aig-meta-session-id: sess_abc123" \
  -H "x-aig-meta-feature-flag: new-summariser" \
  ...
The stored meta column will contain:
⚠️ Read it back with SQL, not with the logs API. The
metafield returned byGET /logsandGET /logs/{id}carries the guardrail protection markers only, not these client-supplied keys — see Custom metadata above. Query them withSELECT JSON_EXTRACT(meta, '$."session-id"') FROM request_log ….
Client metadata is bounded at the trust boundary: at most 16 keys per request (a deterministic
lexicographic subset when more are sent), each key at most 64 characters (longer keys are
dropped), and each value a single string truncated to 256 characters (the first value if a
header repeats). See the x-aig-meta-* caps
for the full accepted shape. These caps guarantee the meta object can never overflow its storage
column, so an over-sized or malformed metadata set never causes the log row to be lost.
Disabling request logging for a tenant
Request logging can be switched off for a whole tenant. When it is off, the gateway stores no request-log entries for the traffic of that tenant, and the Logs view stays empty for it. Billing and quotas are not affected — they do not depend on the request log.
The setting is Disable request logging for this tenant on the tenant settings, and it is restricted to platform administrators. A tenant admin cannot switch off the logging of its own tenant, so a tenant cannot disable its own compliance logging.
When the Logs view is filtered to a tenant whose logging is off — or when a single tenant with logging off is in scope — the view shows the banner Request logging is disabled for tenant "
This control differs from payload logging: payload logging keeps the log entry but drops the prompt and response text, whereas disabling request logging stops the entry from being written at all.
Storage
Request logs are stored and retained by the Myra Security platform. Log retention and backend configuration are managed as part of your service agreement. For enterprise retention or export requirements, contact your Myra Security account team.
ClickHouse analytics sink (optional, off by default)
request_log is a high-volume, analytics-shaped table. The platform can additionally
mirror each entry to a column-oriented ClickHouse store, which compresses the repetitive
prompt history far better and answers time-range analytics/roll-up queries faster. This is a
best-effort shadow copy: the primary MySQL store stays authoritative and is the source
for the Logs view and all reads, and a ClickHouse outage or slowdown never affects,
delays, or fails a request — the mirror is written off the request path and its failures are
counted, never allowed to surface.
The mirror is an operator/deployment capability and is off by default; when
off, behaviour is exactly as documented above with no ClickHouse involvement. It honours the
same per-tenant control as the primary log: a tenant with request logging disabled is not
mirrored to ClickHouse either. (Operator/design detail: docs/internal/request-log-clickhouse.md.)
See also
- Admin dashboard
- Gateway configuration —
log_payloads