Live monitor
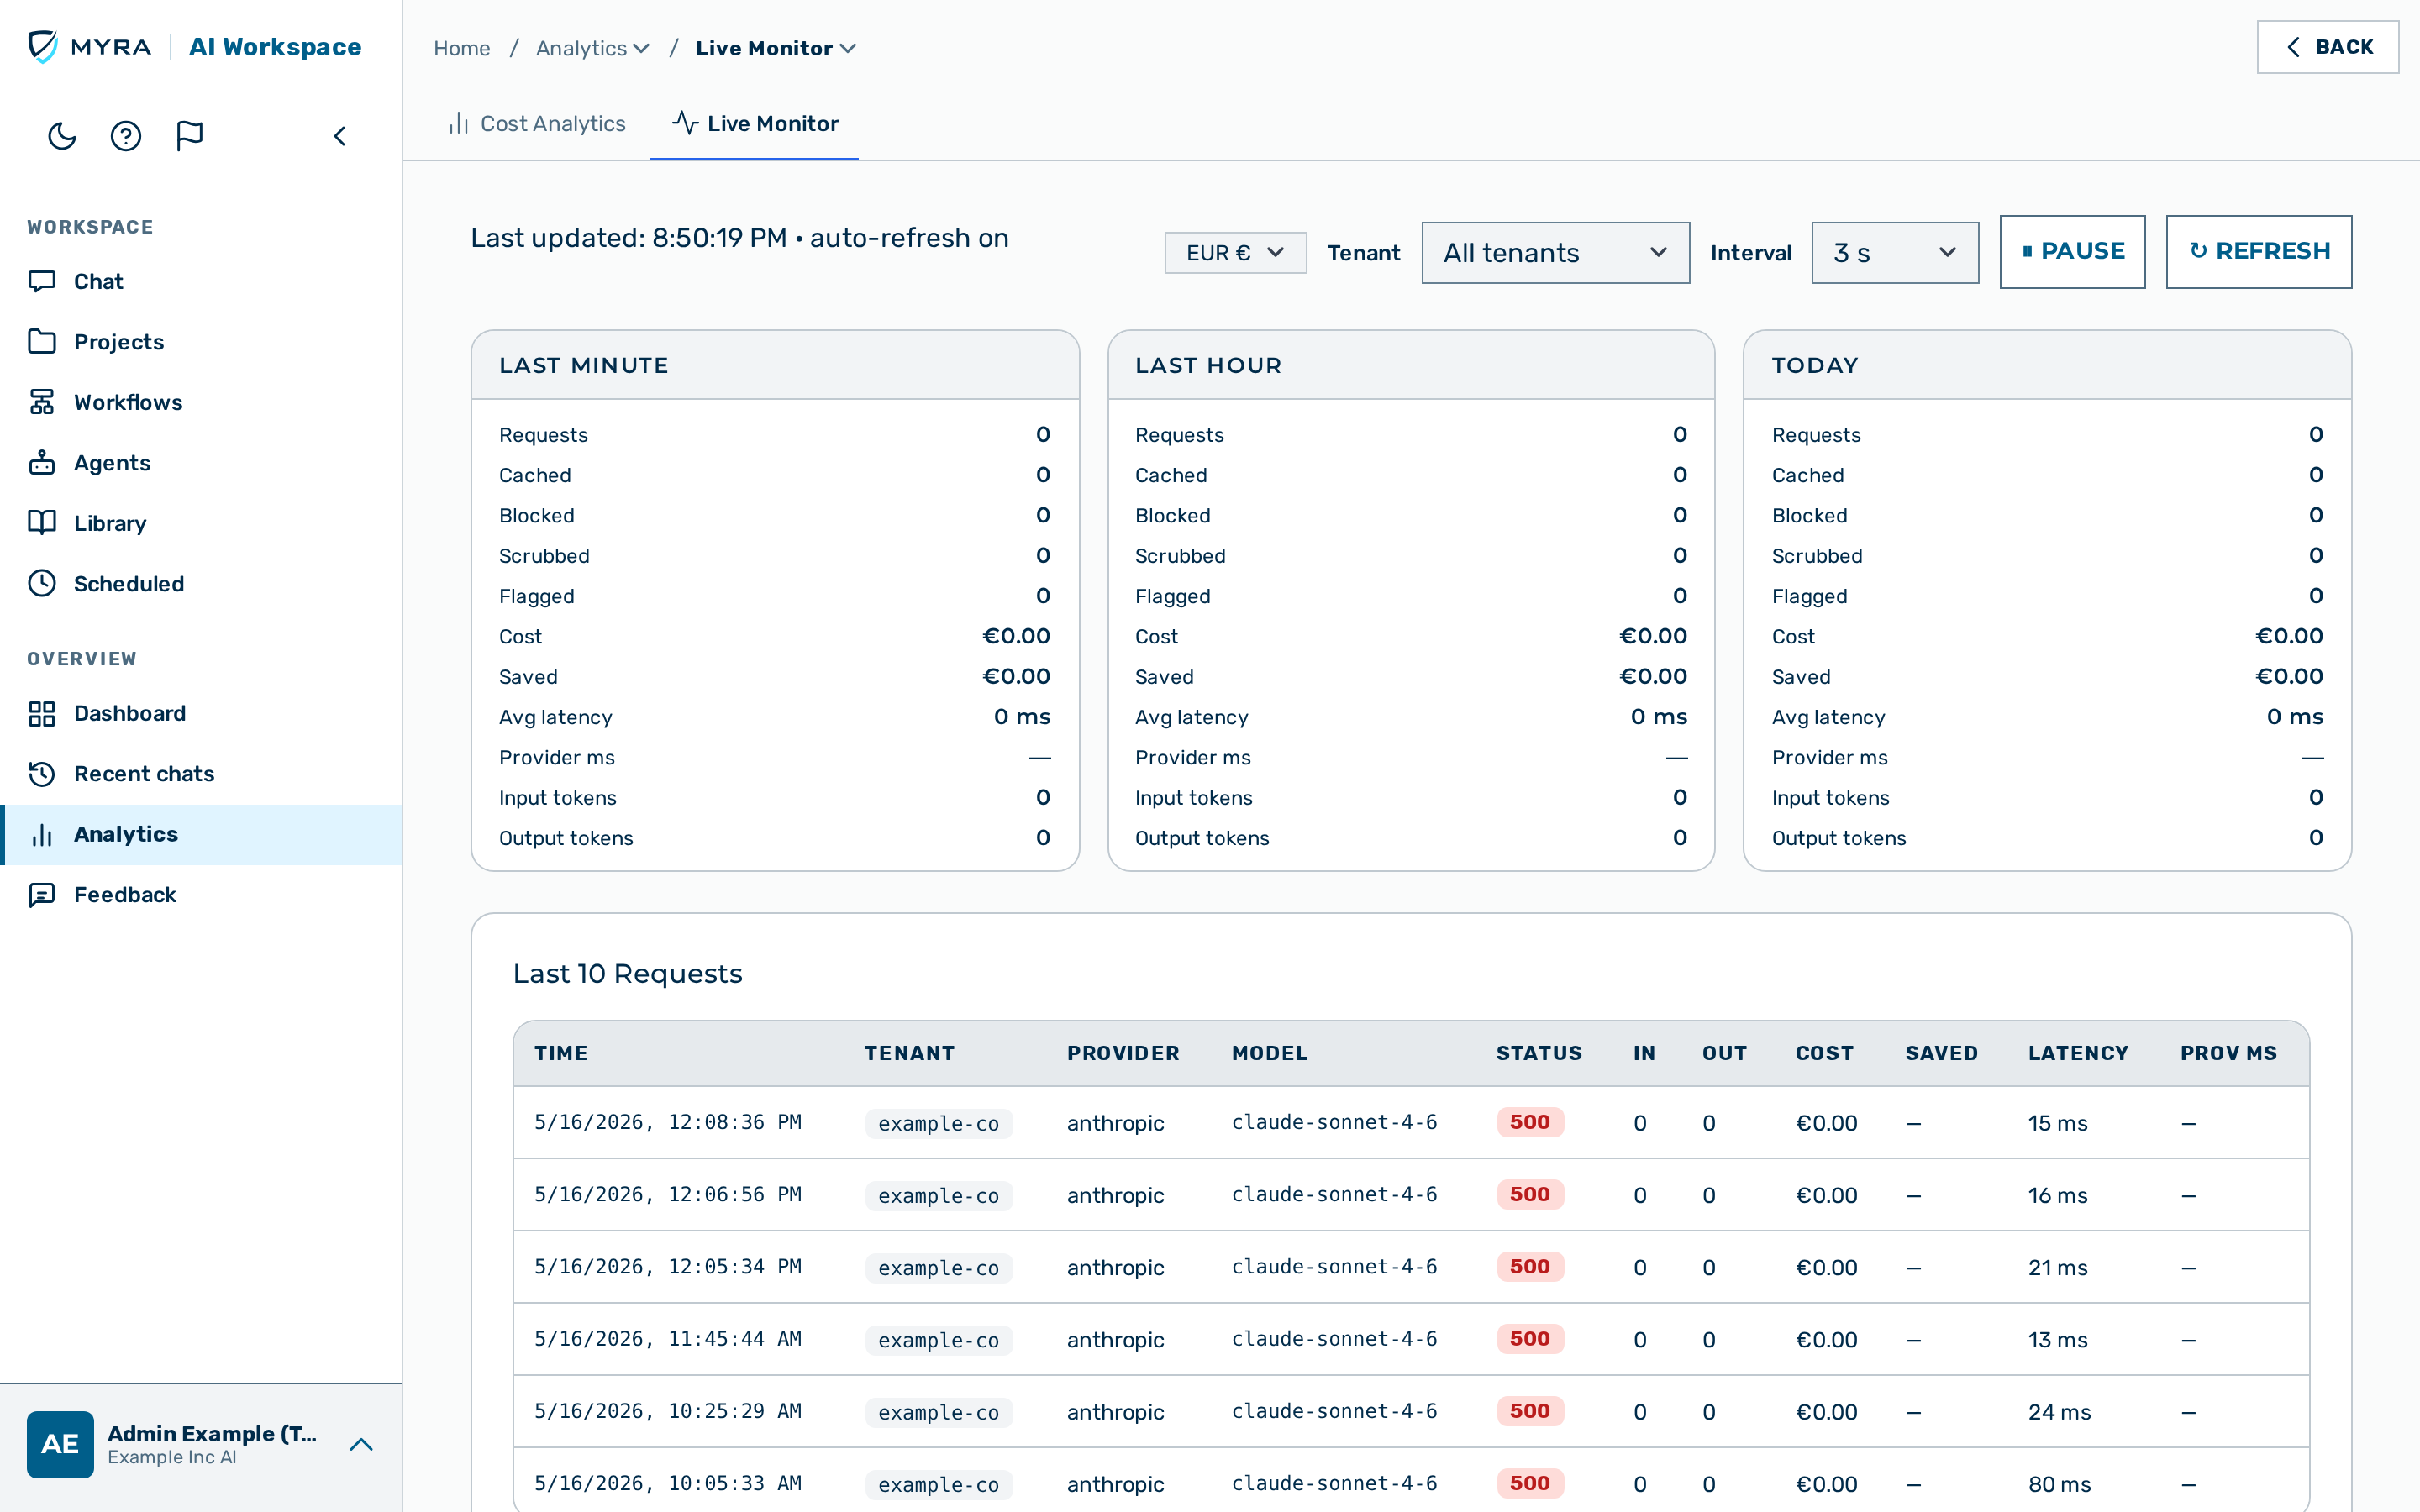 The live monitor showing the activity sparkline, period cards, and controls.
The Live Monitor view provides a real-time view of gateway activity. It polls the Stats API on a configurable interval and displays continuously updating metrics for the current minute, last hour, and today.
Required role: platform admin. Both the view (/monitor) and its /monitor/stats feed are platform-admin-only — the cross-tenant activity view is not exposed to tenant admins or other roles.
Reach it via Overview › Analytics › Live Monitor in the left rail.
Controls
| Control | Description |
|---|---|
| Currency | Sets the currency used for every cost figure on the page. Costs are metered in USD; EUR is shown as an approximate conversion at the daily reference rate (the last known rate, or a built-in reference rate, is used if the rate service is briefly unavailable). |
| Tenant filter | Scopes all metrics to a single tenant. Defaults to all tenants. |
| Interval | Auto-refresh interval: 1 s, 2 s, 3 s (default), 5 s, 10 s, or 30 s. |
| Pause / Resume | Stops or restarts auto-refresh. Metrics freeze on pause. |
| Refresh | Forces an immediate update regardless of the current interval. |
The header shows the timestamp of the last successful poll and whether auto-refresh is running.
Activity sparkline
A rolling line chart plots the trailing-60-second request count (labelled Requests/min) over the last 60 samples. The current value appears to the right of the chart.
Period cards
Three cards break down activity across time windows:
| Card | Window |
|---|---|
| Last minute | Rolling 60-second window |
| Last hour | Rolling 60-minute window |
| Today | From your local calendar midnight to now |
Each card shows the following metrics:
| Metric | Description |
|---|---|
| Requests | Total inference requests |
| Cached | Requests served from cache |
| Blocked | Requests blocked by guardrails or budget |
| Scrubbed | Requests where a guardrail scrubbed content (action = scrub) |
| Flagged | Requests flagged by a guardrail (action = flag) |
| Cost | Total estimated cost in USD |
| Saved | Cost saved by cache hits |
| Avg latency | Average end-to-end latency in milliseconds |
| Provider ms | Average upstream (provider) latency in milliseconds |
| Input tokens | Total prompt tokens consumed |
| Output tokens | Total completion tokens generated |
Tenants — Today
The Tenants — Today table breaks down today's activity per tenant. It is visible only when at least one tenant has activity.
| Column | Description |
|---|---|
| Tenant | Tenant slug |
| Requests | Total requests today |
| Input Tokens | Total prompt tokens consumed |
| Output Tokens | Total completion tokens generated |
| Cost | Total estimated cost |
| Quota Left | The tenant's remaining budget for its current budget period (effective budget minus current-period spend), or no limit when the tenant has no budget. Shows — when the tenant has a budget but its spend could not be read momentarily. An over-cap tenant shows a negative value. |
Last 10 Requests
The Last 10 Requests table shows the ten most recent requests across the selected scope.
| Column | Description |
|---|---|
| Time | Timestamp |
| Tenant | Tenant slug |
| Provider | Provider that handled the request |
| Model | Model name |
| Status | HTTP status code badge, or a blocked / cached badge where applicable |
| In | Input token count |
| Out | Output token count |
| Cost | Estimated cost |
| Saved | Cost saved by a cache hit, or — |
| Latency | End-to-end latency in milliseconds |
| Provider ms | Upstream (provider) latency in milliseconds, or — |
Recent guardrail events
The Recent Guardrail Events table shows the most recent blocked requests. It is like the one on the Dashboard but adds an extra Guardrail (evaluation-latency) column the Dashboard does not show. It is visible only when blocked events exist for the selected scope.
See also
- Dashboard — snapshot view with selectable timeframes
- Cost analytics — historical spend breakdown by tenant, gateway, provider, model, and user
- Stats API